The Vibe: Invisible price floors and ceilings on a chart—support is where the price often bounces up because buyers step in strong, resistance is where it gets stuck or drops because sellers take over.
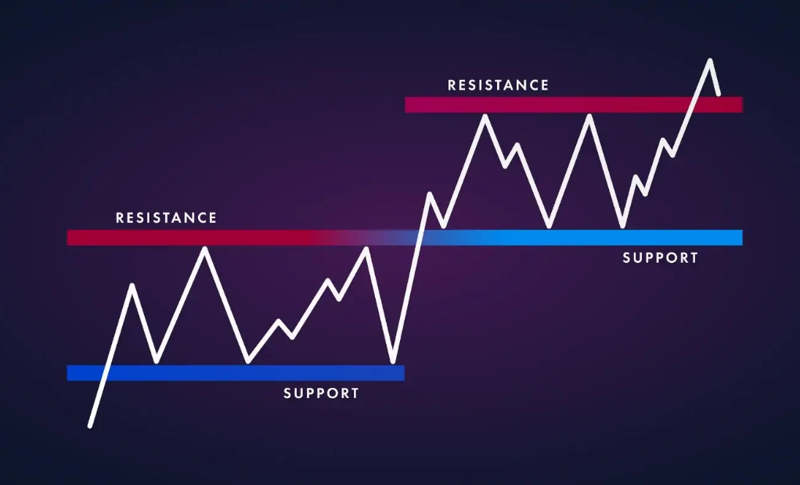
The Details: Support and resistance are key levels on a crypto price chart where the price tends to stop falling (support) or stop rising (resistance). Support acts like a floor: when the price drops to it, buyers usually jump in, pushing it back up (more demand than supply). Resistance acts like a ceiling: when the price rises to it, sellers usually sell off, pushing it back down (more supply than demand). These levels come from past highs/lows, round numbers (like $100k for Bitcoin), or technical patterns. If price breaks through resistance strongly, it can become new support (and vice versa). In crypto, they’re very useful because of high volatility—traders watch them for buy/sell signals, stop-loss placement, or breakout trades.
Pro Tip: Draw support/resistance lines on your charting app (TradingView, DexScreener) using recent swing highs/lows and round numbers. Buy near support with a stop-loss below it; sell or short near resistance. Watch for “breakouts” with high volume to confirm a real move—false breaks are common in crypto, so wait for confirmation before chasing.